Statistical investigation diagrams
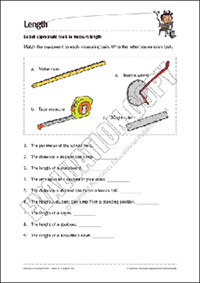
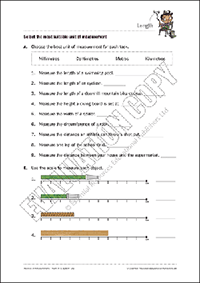
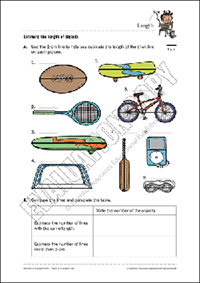
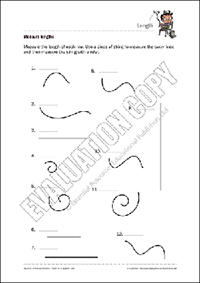
These pages show the steps involved in a statistical investigation cycle, a flow chart to help students plan an investigation and an example of a plan. Each poster could be enlarged for display on the classroom wall or via a data projector.
Resource Types:
Learning Activities and Worksheets
Years:
Year 2, Year 3
|
Pages:
3
|
Code: E5823-15
Series: Hooked On ...
|
AUD incl GST
|
Add to cart | |
| or more | each |
