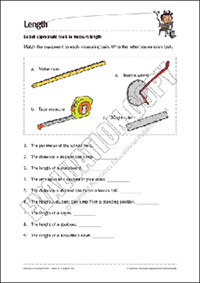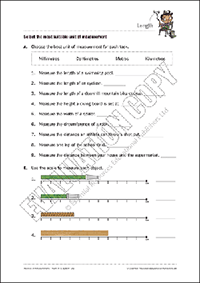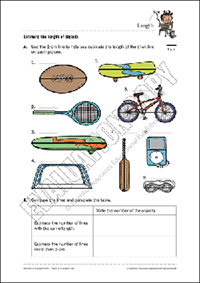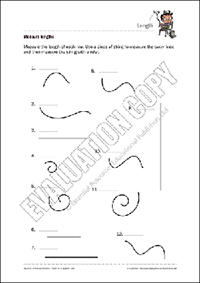
Displaying data in different ways
This unit is designed to reinforce students' learning about the different ways to display data. Students use given information to complete a tally chart, then use the tally chart data to create a pictogram, bar graph and dot plot.
Resource Types:
Learning Activities and Worksheets
Years:
Year 2, Year 3
|
Pages:
4
|
Code: E5823-10
Series: Hooked On ...
|
AUD incl GST
|
Add to cart | |
| or more | each |
