Histograms Cover

Histograms

Ways to present & interpret data

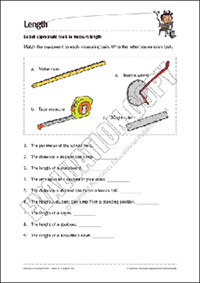
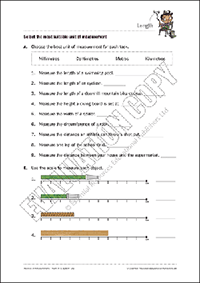
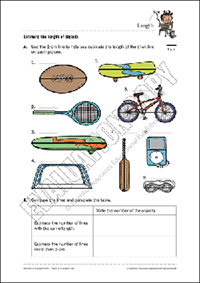
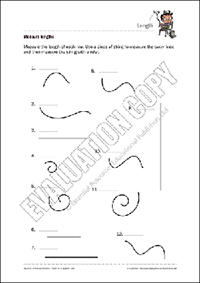
Designed to complement your classroom numeracy programme by developing students' data handling skills, this unit explains how a histogram is constructed and why. Students complete three tasks to reinforce this new knowledge. They then learn how to interpret this kind of graph.

Years: Year 4, Year 5 | Pages: 3 | Code: E5645-11
Series: Hooked On ...

AUD
Add to cart
or more each
Picture of Jo Issa

Jo Issa

Jo Issa is an experienced teacher who has taught in both the UK and New Zealand. She is passionate about making numeracy fun and providing students with the tools they need to solve number problems independently. When she’s not number crunching, Jo pursues another passion: writing. She has a diploma in publishing from Whitireia Community Polytechnic in Porirua, New Zealand and is currently working towards a diploma in creative writing.

Essential Resources acknowledges the Traditional Custodians of the land, sea and community where we work, live and play. We respectfully recognise Aboriginal and Torres Strait Elders, past, present and emerging, and extend that respect to all Aboriginal and Torres Strait Islander peoples.